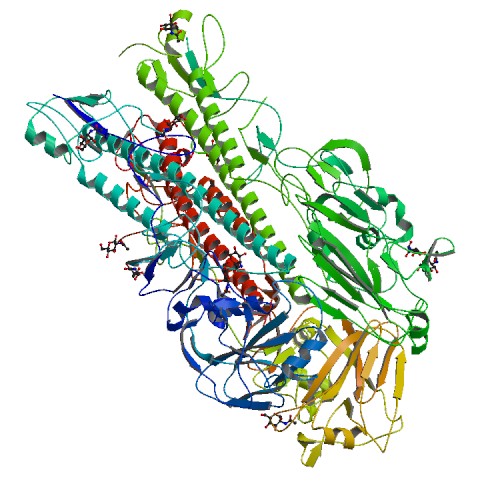
Viral Protein: 1918 H1 Hemagglutinin
This website assesses a peptides hydrophobicity and hydrophilicity based on pre-determined hydropathy scale. The physical properties of the side-chains from each of the 20 amino acids were analyzed to determine appropriate values on a hydropathy scale. The scale ranges from -4.5 to 4.5 representing the most hydrophilic amino acid to the most hydrophobic amino acid respectively. The program was designed in the computer programming language, Python. The program is designed so that a sliding window will analyze segments of the peptide at a time. Each segment is analyzed and calculates the average hydropathy from each segment of the peptide from the amino to the carboxy terminus and then produces a score for that region. A midpoint line is present, which represents the overall average of the hydropathy values from the amino acid composition of from the given sequenced protein.
This computer model for hydropathy was extracted from an article produced by Jack Kyte and Russell F. Doolittle. From the paper, the proposed computer program is dependent on two specific parameters to function. The first of which is the decision of how large a window size for consecutive amino acid residues produces the optimal hydropathy profile for a region in the peptide. Secondly, the calculated hydropathy values are critical for the determination of the hydropathy profile. In this article the researchers discovered, through application that the most ideal window size to analyze regions for hydropathy would be 7 -11 amino acid residues. Also, through manipulation of the hydropathy values, no adjustments were allowed because it would inevitably affect the prediction of hydropathy in regions, which suggests regions that are located on the exterior or interior of the peptide (Kyte and Doolittle 105-132).
Upon analysis of the hydropathy profile produced from the computer model there are two key points that can be extrapolated from the data. The line from the hydropathy profile that extends above the midpoint line indicates regions that are part of the interior of the protein, hydrophobic regions. Adversely, the region of the graph with the line from the hydropathy profile that extends below the midpoint line indicates regions that are part of the exterior of the protein, hydrophilic regions. This simple computer program makes the evaluation of protein structures much easier to analyze because of the graphic visualization.
References
Kyte, J, R. Doolittle. "A simple method for displaying the hydropathic character of a protein." Journal of Molecular Biology 157(1982): 105-132.